
Sep 25, 2026
The Gap Between ONS Data and Web Signals for UK Firms
Official ONS business data often lags behind the real daily operations of UK firms due to annual reporting cycles. While government registers provide a legal baseline, live web signals reveal immediate hiring, technology shifts, and actual commercial activity. Analysts improve accuracy by combining statutory filings with verified digital footprints to track company growth.

Government registers often lag behind the real daily operations of active British companies. You risk building sales pipelines and market models on outdated employee numbers, old addresses, and generic trade codes. The Office for National Statistics surveys hundreds of thousands of firms every year, but annual reporting cannot capture rapid digital shifts. Observable web footprints reveal immediate hiring patterns, technology changes, and commercial activity as they happen online. This comparison examines where official metrics diverge from live online signals across the United Kingdom.
Measuring AI Adoption Across Company Sizes
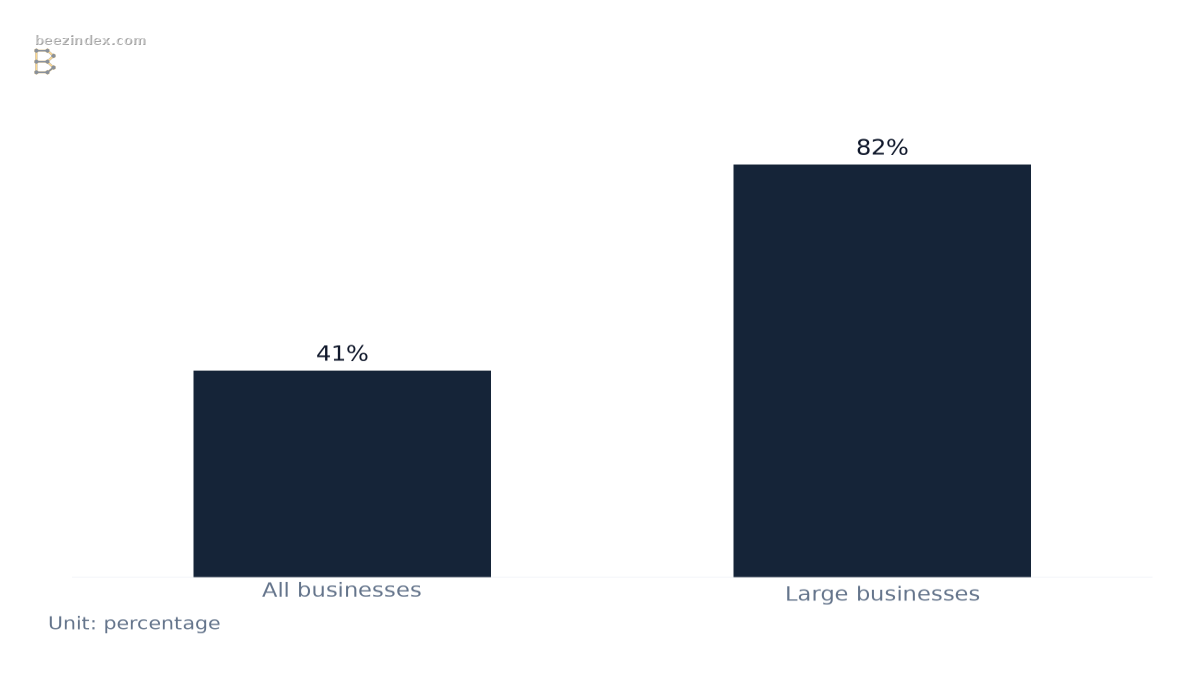
Official surveys show clear differences in technology usage across corporate tiers in the United Kingdom. Technology adoption creates distinct online footprints because larger corporations deploy software infrastructure at much higher volumes than smaller competitors. For example, 41% of businesses handling digitised data use AI, with adoption reaching 82% among large businesses. This split illustrates why market researchers struggle when they rely on static registers alone without checking active website systems.
Corporate directories frequently fail to track modern operational shifts because regulatory filings update only once per year. Analysts face significant blind spots caused by misleading industry classification standards when evaluating digital capabilities. In contrast, observable web footprints show active technology deployments directly on live domains. Tracking these public indicators helps commercial teams verify true operational scale without waiting for annual statistical releases.
AI Adoption Rates by Business Size
Understanding Inter-Departmental Business Register Sampling
Official government economic statistics rely heavily on administrative records from taxation agencies. The ONS distributes 2.3 million questionnaires annually to a sample of 355,000 businesses to monitor national output.[2] This survey method captures structured fiscal data but excludes live commercial signals.
Statisticians select survey participants using the Inter-Departmental Business Register to represent the broader economy.[2] These administrative files record registered legal entities rather than active operational branches.
Small firms often provide informed estimates rather than precise accounting figures on these official forms. Researchers must recognize that administrative data reflects formal compliance rather than daily digital operations.
Tracking Website Presence Across British Enterprises
Digital adoption among commercial enterprises has expanded rapidly across England, Scotland, Wales, and Northern Ireland. Official figures confirm that 78% of UK businesses have a website, an increase from 68% in 2023-2024. This rapid growth creates a valuable pool of real-time operational indicators that researchers can inspect directly. However, the presence of a live domain does not automatically guarantee that statutory records reflect current trading activities.
Recruitment professionals and commercial analysts routinely evaluate digital pages to uncover organizations expanding teams across regional markets. Web pages display open vacancies, technical job requirements, and customer portals long before official employment databases update. Commercial teams improve outreach efficiency because live digital activity reflects immediate commercial needs. Combining public web indicators with statutory filings provides a clearer assessment of active enterprise operations.
Company Size Thresholds and Reporting Limits
Statutory filing requirements changed significantly following recent updates to British company law. The UK government increased the turnover threshold for micro-entities to £1 million and small companies to £15 million effective April 2025.[1] These higher financial boundaries mean fewer enterprises need to disclose detailed profit figures on public registers.
Firms qualify for specific size categories by meeting two out of three criteria covering turnover, balance sheet totals, and headcount.[1] Headcount calculations require finding the monthly average of workers across the entire financial year.
Audit Exemptions and Reduced Financial Disclosure
Statutory accounting exemptions allow smaller corporate entities to limit the amount of financial information filed publicly. Small companies claiming audit exemption may save between £5,000 and £15,000 annually in audit fees.[1] These cost savings encourage firms to file simplified accounts that omit detailed income statements from registry databases.
Commercial analysts often find it difficult to analyze recent tender results when target vendors submit abridged balance sheets. In contrast, online footprints provide evidence of operational software, customer portals, and corporate partnerships. Public web signals reveal commercial momentum when statutory filings provide minimal financial visibility.
Evaluating Technographic Data and Stack Footprints
Web scrapers examine frontend code to identify analytics packages, customer relationship managers, and payment processors. Detection of a technology on a website does not prove organization-wide use or reveal a complete internal stack. Market analysts must evaluate these digital footprints carefully before assuming full operational adoption.
Enterprise platforms operate differently because backend architectures remain invisible to public crawlers. For example, only 2.6% of mid-market firms with SAP ERP were found to also have MuleSoft in a specific study. BeezIndex Ltd indexes observable online footprints across millions of British websites to help analysts check operational tools. Users can start with a free search to explore company data and review initial matching confidence.
Researchers must document a lawful basis under GDPR when collecting business intelligence that connects with personal contact details. Web-scan data can be up to 30 days behind current status, which requires continuous verification. Combining public registry filings with verified digital indicators helps analysts build dependable company profiles.
Resolving Data Discrepancy Across Corporate Records
Corporate analysts often face conflicting metrics when comparing official tax records with observable online activity. Regulatory databases update on rigid annual schedules, whereas company websites change content, locations, and service offerings weekly. This temporal gap causes severe data discrepancy when measuring corporate growth or sector focus. Successful research teams verify firm scale by cross-referencing live hiring pages, customer portals, and technology deployments.
Commercial sales departments frequently suffer pipeline friction by cutting unnecessary digital tools and relying on unverified lists. Sales reps waste valuable working hours when outreach databases display dormant companies or incorrect operational scales. Verifying company size through direct digital evidence ensures high confidence before teams initiate expensive outbound campaigns. Combining statutory baselines with observable web intelligence delivers the most accurate picture of British commerce.
What to Remember
Official business registers provide a legal baseline for UK corporate entities, but they cannot show live commercial velocity. SMEs represent 99.85% of the total UK business population, yet thousands change services and headcounts without immediate statutory updates.[3] Relying entirely on annual filings leaves researchers and commercial teams with stale operational intelligence.
Modern market analysis requires combining statutory records with live online indicators. Researchers should verify company size, active software stacks, and hiring intentions by examining public digital signals directly. Start with verified company-to-website intelligence to maintain high confidence in your commercial market research.
Frequently Asked Questions
Why does ONS business data differ from company websites?
The ONS collects administrative and survey data on fixed annual cycles from tax and registry records. In contrast, company websites update continuously to reflect new branding, active hiring, and current product offerings.
What are the updated UK small company size thresholds?
Effective April 2025, small companies can report turnover up to £15 million and balance sheet totals up to £7.5 million. Headcount thresholds remain capped at 50 or fewer employees.
How often does web-scan intelligence refresh?
Public web-scan data typically refreshes on schedules ranging from daily crawls to cycles up to 30 days old. Analysts should always check the last refresh date before making strategic decisions.
Are online hiring signals proof of verified employment?
Active hiring signals serve as evidence-based indicators of planned corporate growth rather than definitive headcount statements. Job postings over 45 days old are frequently paused or represent internal recruitment efforts.
How should analysts resolve company location conflicts?
Official records often list an accountant's office or virtual registered office address for legal correspondence. Analysts should check website contact pages, branch directories, and local domain registrations to locate physical operations.
Start with a free search to explore live company activity, technology deployments, and verified digital signals across the United Kingdom.
Verify UK Companies With Observable Web Signals